Explainer: how do you measure a sea’s level, anyway?
There are about 330 million cubic miles of water in the world oceans today, 97% of all the water on the planet. Early in our planet’s 4.5 billion year history, water from the atmosphere and from the interior of the Earth gradually collected in the low areas on the planet’s surface to form the ocean basins, accumulating salts along the way.
The level of the ocean around the Earth, and therefore the location of the shoreline, are directly related to the total amount of water in the oceans, and also closely tied to climate. As climate changes, so does sea level.
Throughout the history of the oceans, which goes back about 3.5 billion years, give or take a few million, climate has constantly changed and, in response, sea level has gone up and down. As seawater warms, it expands and sea level rises. As the Earth warms, ice sheets and glaciers melt and retreat, adding more water to the oceans, which raises sea level.
People have been keeping track of sea level, or the elevation of the oceans, for about 200 years. Until fairly recently, this was done with tide gauges, which are water-level recorders anchored to some structure along the coastline. It might be a wharf, a concrete breakwater or some other solid structure that is stable over long periods of time.
The oldest tide gauge in the world is on the coast of Poland and was installed in 1808. In the United States, there are two tide gauges that have been in operation since 1856, one in New York and one in San Francisco. There are many others as well, but most of them are much newer; many were set up over the past 50-75 years.
A tide gauge is essentially a large pipe inserted into the ocean, which has a float inside that moves up and down as the water level changes. As the tide rises and falls each day, these gauges record those changes in water level, day after day, year after year.
These instruments were first set up to provide accurate information on water depths so ships could enter and leave ports safely. As time went on, however, it became clear that sea level recorded on these instruments was rising globally.
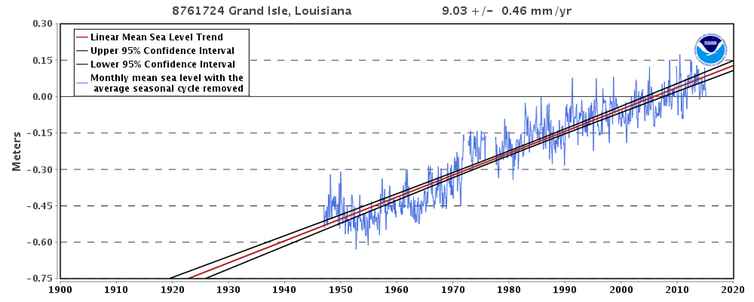
Each of these official tide gauges keeps track of sea level at a particular coastal location. Many coastal areas are not stable, however. Some are sinking (such as New Orleans or Venice), and some are rising (Alaska and Scandinavia, for example). Each tide gauge keeps track of how sea level is changing relative to the land on which it is anchored.
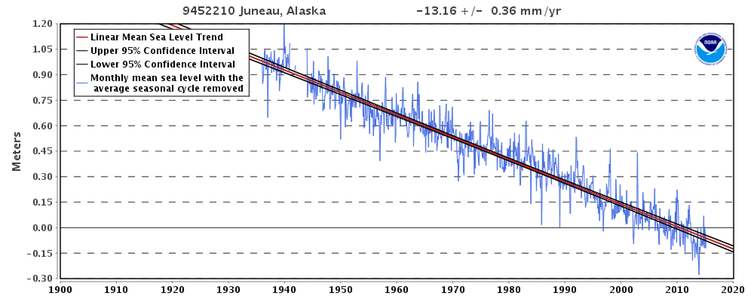
Even though sea level rose around the world at a rate of about 1.7 millimeters per year over the last century (nearly seven inches per century), because some gauges are on coasts that are rising and some on coasts that are sinking, these local sea-level rise rates will vary. In parts of Alaska, the land is rising faster than sea level, so the tide gauge actually records a drop in sea level relative to the land.
These geographic variations were resolved in 1993 when two satellites were launched that use radar to measure the level of the ocean very precisely from space. This high-tech approach eliminates the problems of land motion on Earth and has given us a new global sea-level rise rate over the past 22 years of 3.2 millimeters per year, the equivalent of 12 inches per century.
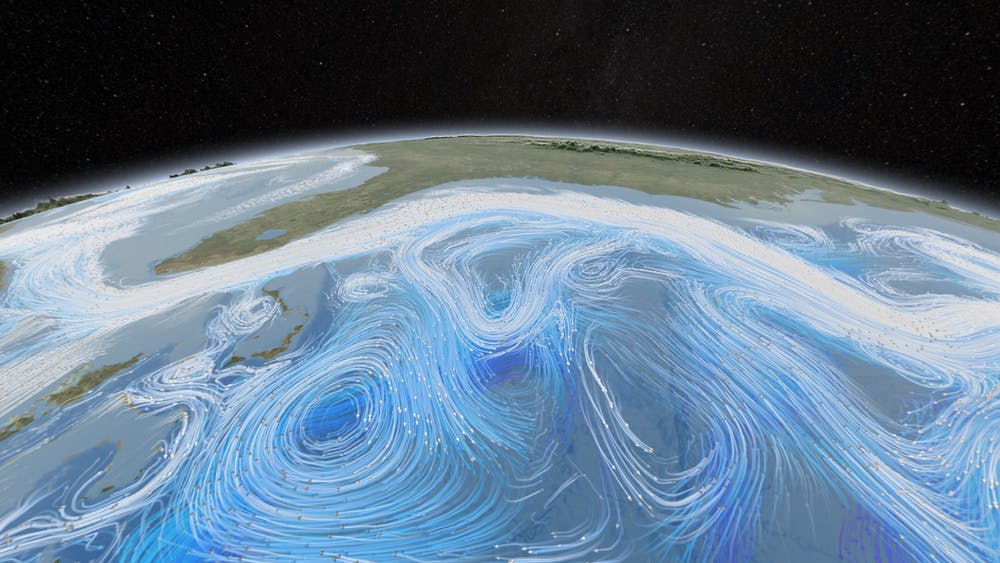
Elevations on land, contour lines on maps and depths on nautical charts are based on the long-term average of sea level. This is complicated by the fact that sea level around the world at any instant is not the same, due to local variations resulting from differences in water temperatures, currents, atmospheric pressure and wind.
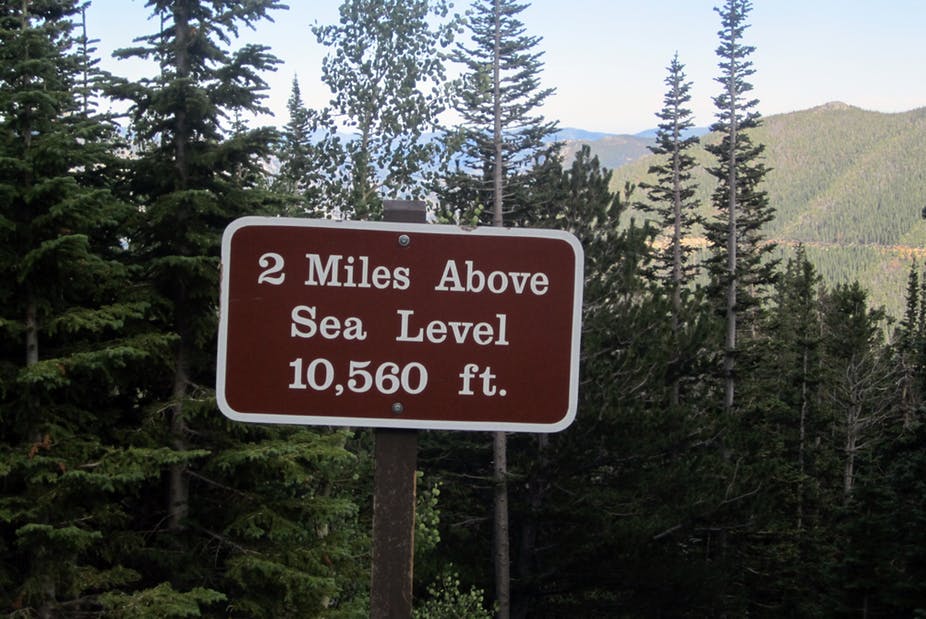
In order to bring some order to all of these geographical variations, and to provide a constant point of reference, a datum or base level was established based on averaging out the elevation of sea level from many tide gauges over an extended period of time. This datum is now called the North American Vertical Datum (or NAVD) and is the elevation (close to mean sea level) on which all map elevations are based. So if a wharf, highway or building is “20 feet above sea level,” it is 20 feet above this official North American Vertical Datum.