Observed and Projected Temperature Change
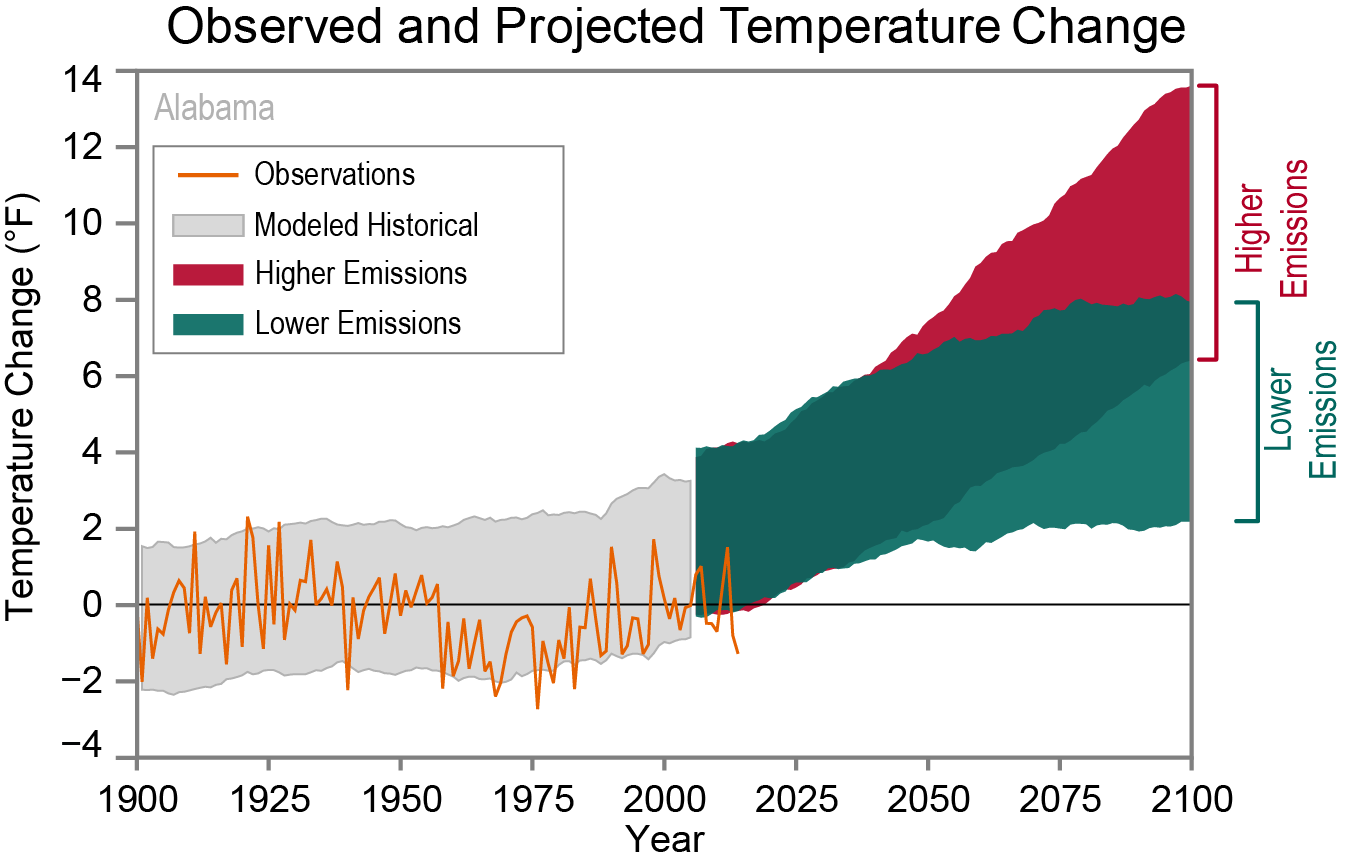
Observed and projected changes (compared to the 1901–1960 average) in near-surface air temperature for Alabama. Observed data are for 1900–2014. Projected changes for 2006–2100 are from global climate models for two possible futures: one in which greenhouse gas emissions continue to increase (higher emissions) and another in which greenhouse gas emissions increase at a slower rate (lower emissions). Temperatures in Alabama (orange line) were high in the 1920s and 1930s then decreased by about 2°F into the 1960s and 1970s. Temperatures have increased by about 1.5°F since the 1970s. Shading indicates the range of annual temperatures from the set of models. Observed annual temperatures are generally within the envelope of model simulations of the historical period (gray shading), but on the very low end. However, for summer daytime maximum temperatures, which have decreased over the 20th century, this localized cooling is not well simulated by climate models. If Alabama were to continue to follow the low end of model projected temperatures, by the end of the 21st century average temperatures would be about as warm as the hottest historical year under a lower emissions scenario and about 4°F warmer than the hottest historical year under a high emissions scenario.
Source: CICS-NC and NOAA NCEI.