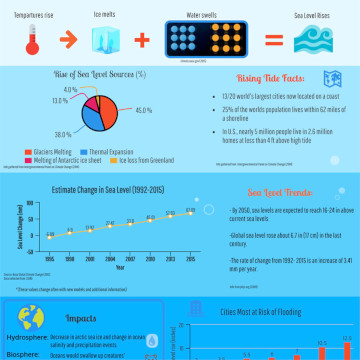
Bifrost
How it Works
  • Themes
  • Bifrost Documentaries
  • Bifrost Insights
  • About
  • Features
  • Bridges
Mode

Sea-level Rise

https://bifrostonline.org/wp-content/uploads/2018/05/Sea_level_Rise.mp4

For over 20 years NASA has been tracking the global surface topography of the ocean in order to understand the important role it plays in our daily lives. Climate change is causing our ocean to warm and glaciers to melt, resulting in sea level rise. Since 1880, the global sea level has risen 8 inches; by 2100, it is projected to rise another 1 to 4 feet.

Credit: NASA’s Earth Minute Sea-level Rise, originally published in NASA Climate Change, 2015 (CC-BY-SA 4.0)

Curated by Lea Rekow for BifrostOnline
Global warmingIce meltNASASea-level rise

Related

Mapping Choices: Tokyo, Japan

Engaging the public to rescue information from eroding and destroyed coastal archaeological sites

The Guidoiro Areoso experience in NW Iberia

Sea level and coastal flood risk calculator

Explore US sea level and coastal flood risks by region through data visualizations. Developed by Surging Seas Climate Central.

A New Forecast Model Gives Scientists a Longer View of Arctic Sea Ice

Scientists have developed a new model to predict the sea ice minimum extent, using historical measurements and real-time satellite data.
  • Bifrost
    Themes
  • Bifrost
    Documentaries
  • Bifrost
    Insights
  • Bifrost
    Features
  • About
    Bifrost
  • Bridges
  • Papers &
    Reports
  • Interview
    Transcripts
  • Infographics
  • Maps
  • Science
  • Data
    Visualizations
  • Climate Stories
  • Podcasts
  • Presentations
  • Curated
    Perspectives
  • Sound Art
  • Image
    Galleries
  • How it
    Works
  • Exposing Denial
  • Calculators &
    Indices
  • Climate Kids
  • Open
    Learning
  • Resource
    Atlases
  • SDG
    Trackers
  • Toolkits
  • Mobilize
  • Twitter
  • Facebook
  • Instagram
  • Youtube
  • Privacy Policy