Sea Level Rise
The climate has always been changing and the oceans have risen and fallen accordingly. Sea level is now 120 meters higher than it was 20,000 years ago; a world of more ice and land bridges unrecognizable to us now. Inversely, in warmer periods the oceans have been anywhere between 6 to 30 meters higher than where they are currently. The difference now is that we are both causal to and threatened by the changes taking place.
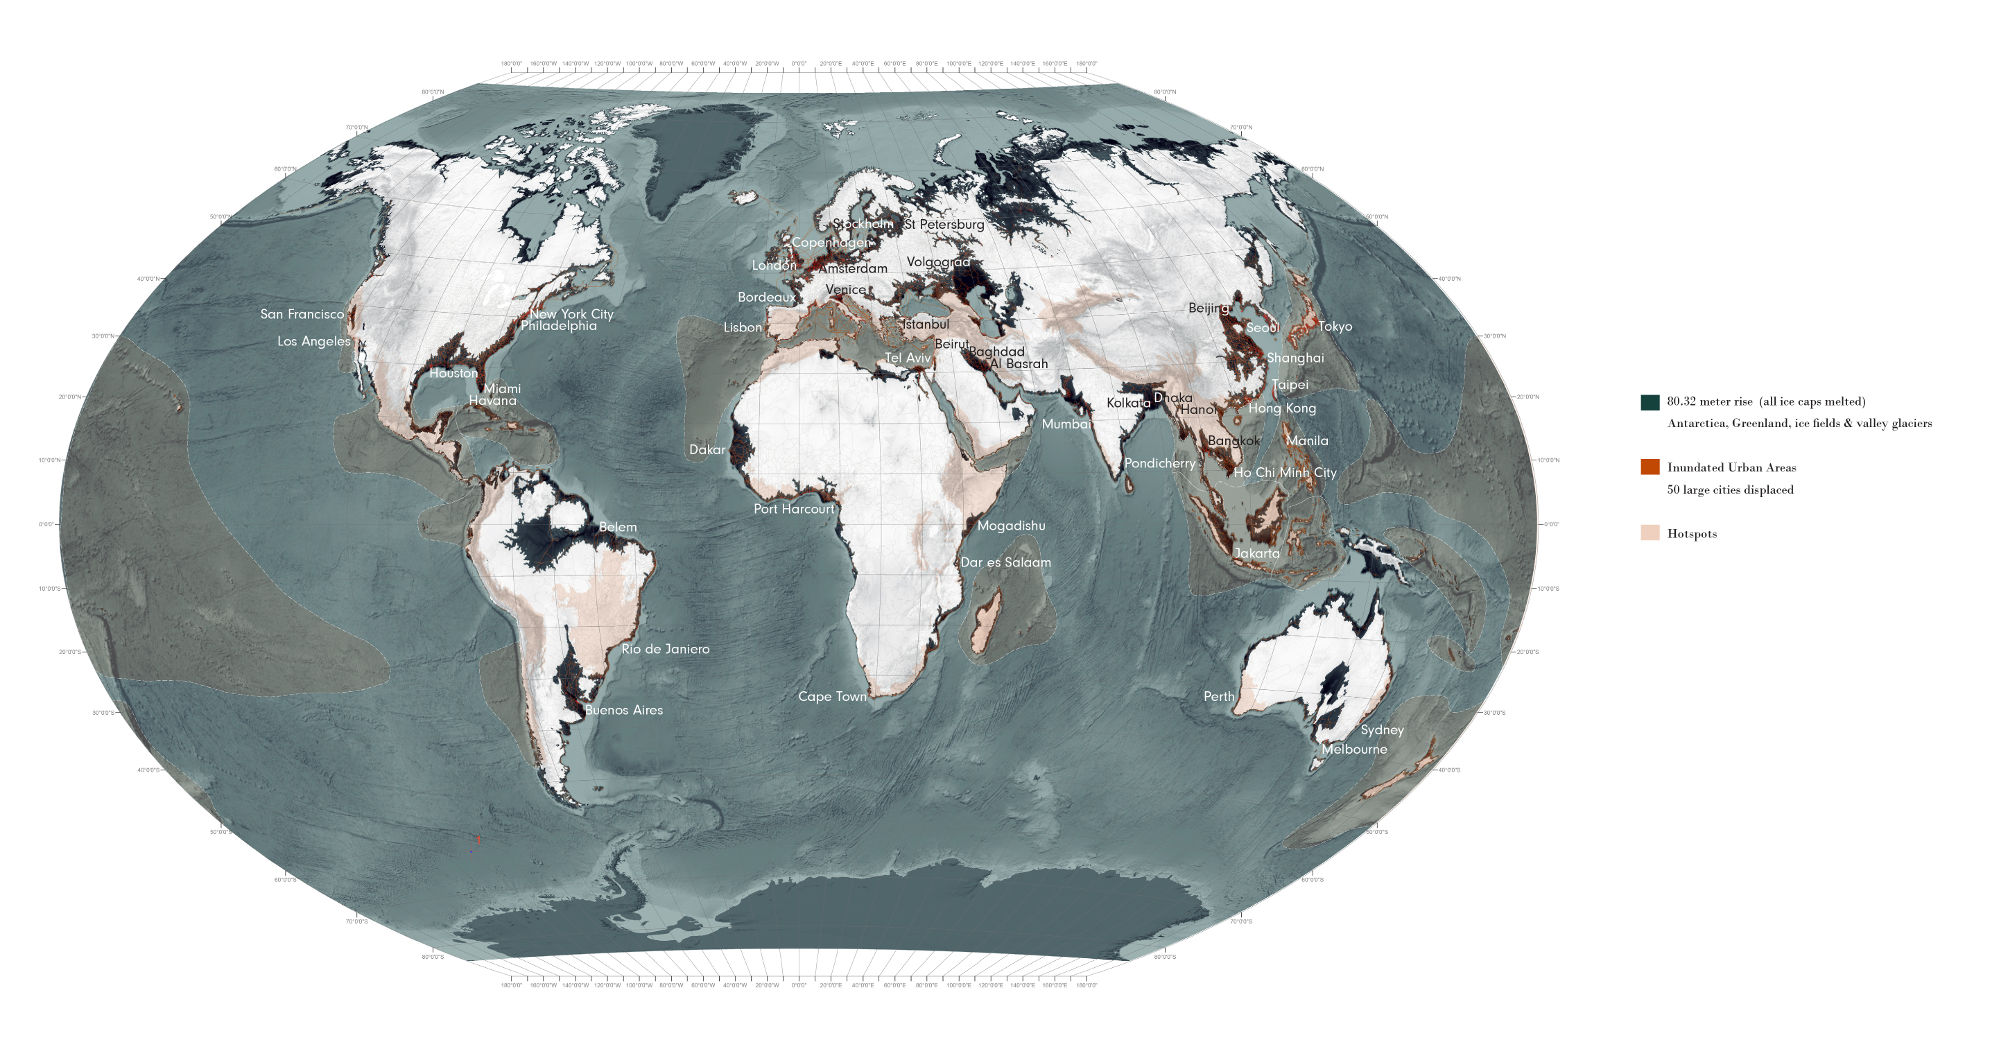
This map shows the land which would be flooded if the ice caps melt in entirety, in which case the sea level would rise by 80.32 meters. 1 In this scenario, vast new coastlines and inland seas will be created and 50 of the world’s major cities would become architectural reefs. Even if sea level rises only 0.74 meters by 2100 as is conservatively predicted some 115 million people will likely be displaced and 420,000 km2 of land will be lost to the encroaching seas. 2
Adapting to rising sea levels involves three general strategies, that is, 1) the construction of defensive structures, 2) so called ‘nature based strategies’ — a combination of preserving and reconstructing coastal landscapes so they buffer and absorb rising waters, and finally 3) gradual retreat from the coastline. All three are proving extremely difficult to achieve in places where hitherto the environment has been assumed to be more or less stable.
1 R. Z Poore, R. S. Williams Jr., & Christopher Tracy, “Sea level and climate,” US Geological Survey Fact Sheet 002-00 (2000). Available at http://pubs.usgs.gov/fs/fs2-00/ (accessed December 2, 2014).
2 NASA Socioeconomic Data and Applications Center (SEDAC) of the Center for International Earth Science Information (CIESIN) / Columbia University, “Low Elevation Coastal Zone: Urban-Rural Population and Land Area Estimates version 2,” (Palisades, NY: 2013). Available at http://sedac.ciesin.columbia.edu/data/set/lecz-urban-rural-population-land-area-estimates-v2 (accessed October 8, 2014).
Map created by Richard Weller, Claire Hoch, and Chieh Huang using data/information from the following sources:
1. 80-meter rise
R. Z Poore, R. S. Williams Jr., & Christopher Tracy, “Sea level and climate,” US Geological Survey Fact Sheet 002-00 (2000). Available at http://pubs.usgs.gov/fs/fs2-00/.
2. Displace Population and Land Lost numbers
NASA Socioeconomic Data and Applications Center (SEDAC) of the Center for International Earth Science Information (CIESIN) / Columbia University, “Low Elevation Coastal Zone: Urban-Rural Population and Land Area Estimates version 2,” (Palisades, NY: 2013). Available at http://sedac.ciesin.columbia.edu/data/set/lecz-urban-rural-population-land-area-estimates-v2 (accessed October 8, 2014).
3. Hotspots
Critical Ecosystem Partnership Fund, “The Biodiversity Hotspots,” http://www.cepf.net/resources/hotspots/pages/default.aspx (accessed July 1, 2014). Data made available under the Creative Commons BY-SA 4.0 License: https://creativecommons.org/licenses/by-sa/4.0/legalcode.