Bifrost
Infographics
  • Themes
  • Bifrost Documentaries
  • Bifrost Insights
  • About
  • Features
  • Bridges
Mode

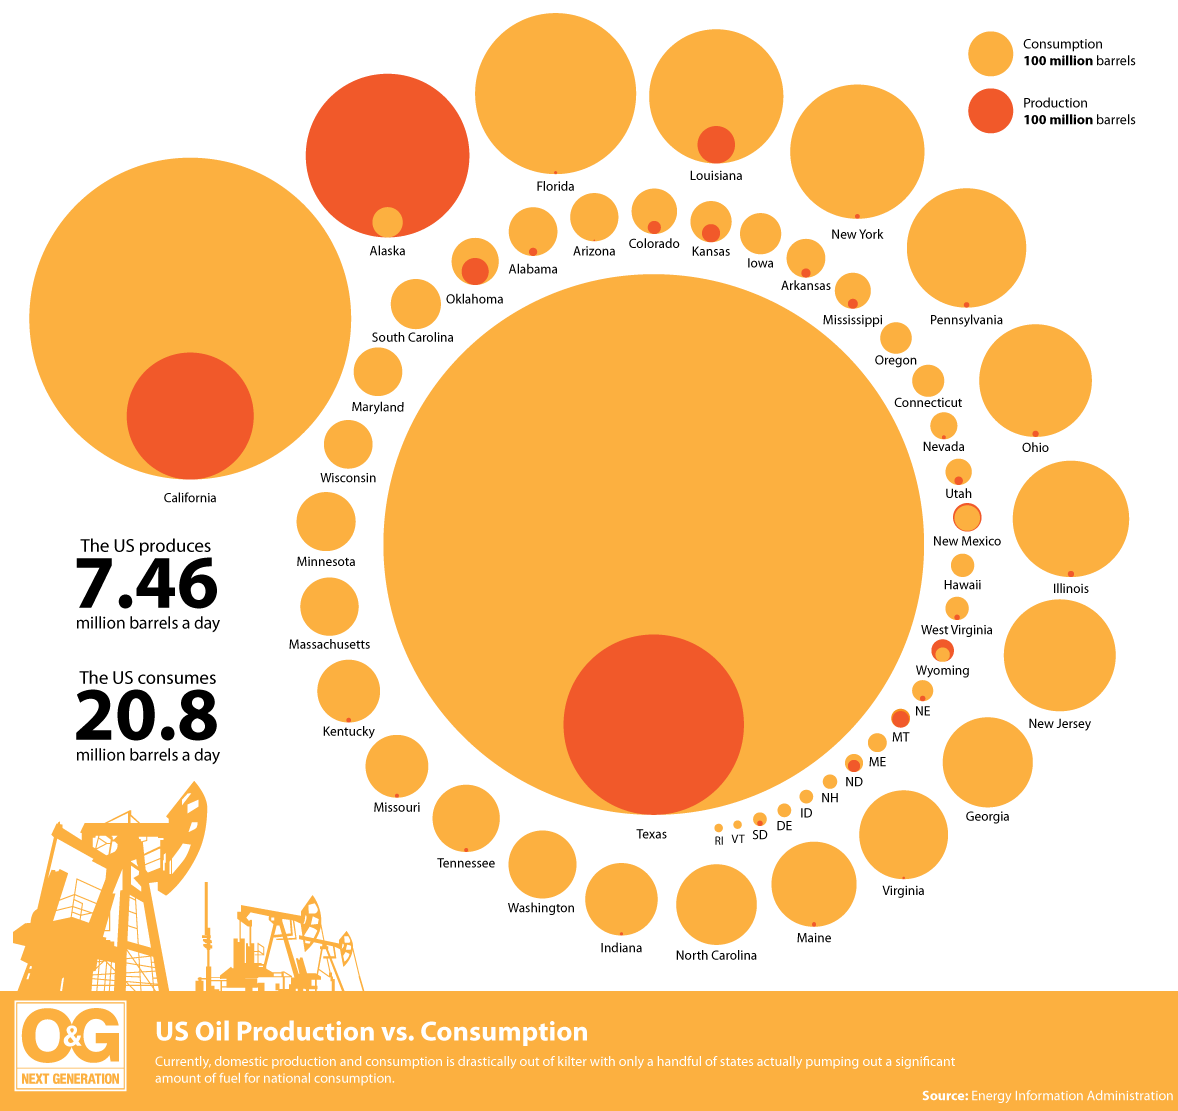
US oil consumption vs. production

GDS infographics via Flickr (CC BY-SA 2.0)
Curated by Lea Rekow for BifrostOnline
ConsumptionEnergyFossil fuelsNatural resourcesOil

Related

Open Learning Module: Energy

What’s your vision for a Fossil Free World?

Smoke and Fumes

The Legal and Evidentiary Basis for Holding Big Oil Accountable for the Climate Crisis

Winning the Fight Against Fossil Fuels in New York (And What’s Next)

  • Bifrost
    Themes
  • Bifrost
    Documentaries
  • Bifrost
    Insights
  • Bifrost
    Features
  • About
    Bifrost
  • Bridges
  • Papers &
    Reports
  • Interview
    Transcripts
  • Infographics
  • Maps
  • Science
  • Data
    Visualizations
  • Climate Stories
  • Podcasts
  • Presentations
  • Curated
    Perspectives
  • Sound Art
  • Image
    Galleries
  • How it
    Works
  • Exposing Denial
  • Calculators &
    Indices
  • Climate Kids
  • Open
    Learning
  • Resource
    Atlases
  • SDG
    Trackers
  • Toolkits
  • Mobilize
  • Twitter
  • Facebook
  • Instagram
  • Youtube
  • Privacy Policy