Bifrost
Data Visualizations
  • Themes
  • Bifrost Documentaries
  • Bifrost Insights
  • About
  • Features
  • Bridges
Mode

February 2017 Arctic Sea Ice Update

https://bifrostonline.org/wp-content/uploads/2018/02/February_2017_Arctic_Sea_Ice_Update.mp4

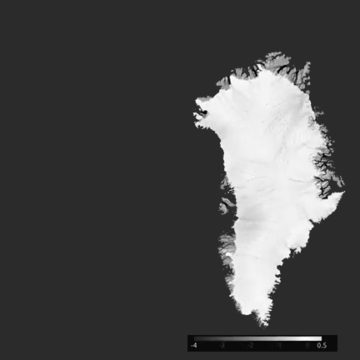
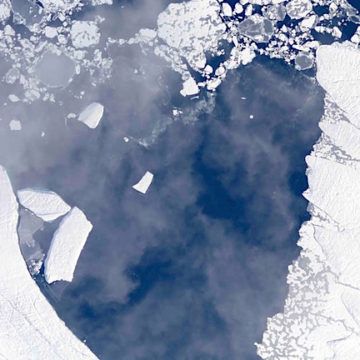
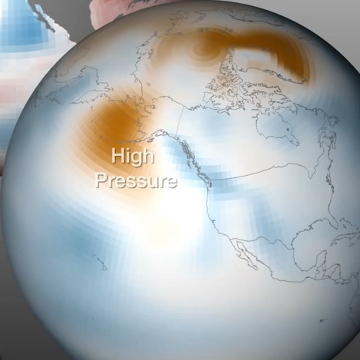
Weekly satellite data/imaging from September 2016 through February 2017 shows lowest historical sea ice levels.

Credit: NOAA, February 2017 Arctic Sea Ice Update, originally published in NOAAVisualizations, 2017 (CC-BY-SA 4.0)

Curated by Lea Rekow for BifrostOnline
Arctic sea iceIce meltNOAASatellite imaging

Related

A New Forecast Model Gives Scientists a Longer View of Arctic Sea Ice

Scientists have developed a new model to predict the sea ice minimum extent, using historical measurements and real-time satellite data.

Sea-level Rise

NASA's Earth Minute

The Hidden Meltdown of Greenland

NASA-supported researchers have found that ice covering Greenland is melting faster than previously thought. The action is happening out of sight, below the surface.

Arctic Sea Ice Levels

The sea ice cap changes minimum summertime extent, which typically occurs in September, has been decreasing for decades at a rapid pace.
  • Bifrost
    Themes
  • Bifrost
    Documentaries
  • Bifrost
    Insights
  • Bifrost
    Features
  • About
    Bifrost
  • Bridges
  • Papers &
    Reports
  • Interview
    Transcripts
  • Infographics
  • Maps
  • Science
  • Data
    Visualizations
  • Climate Stories
  • Podcasts
  • Presentations
  • Curated
    Perspectives
  • Sound Art
  • Image
    Galleries
  • How it
    Works
  • Exposing Denial
  • Calculators &
    Indices
  • Climate Kids
  • Open
    Learning
  • Resource
    Atlases
  • SDG
    Trackers
  • Toolkits
  • Mobilize
  • Twitter
  • Facebook
  • Instagram
  • Youtube
  • Privacy Policy