Bifrost
Infographics
  • Themes
  • Bifrost Documentaries
  • Bifrost Insights
  • About
  • Features
  • Bridges
Mode

Global GHG Emission Countries and Industries

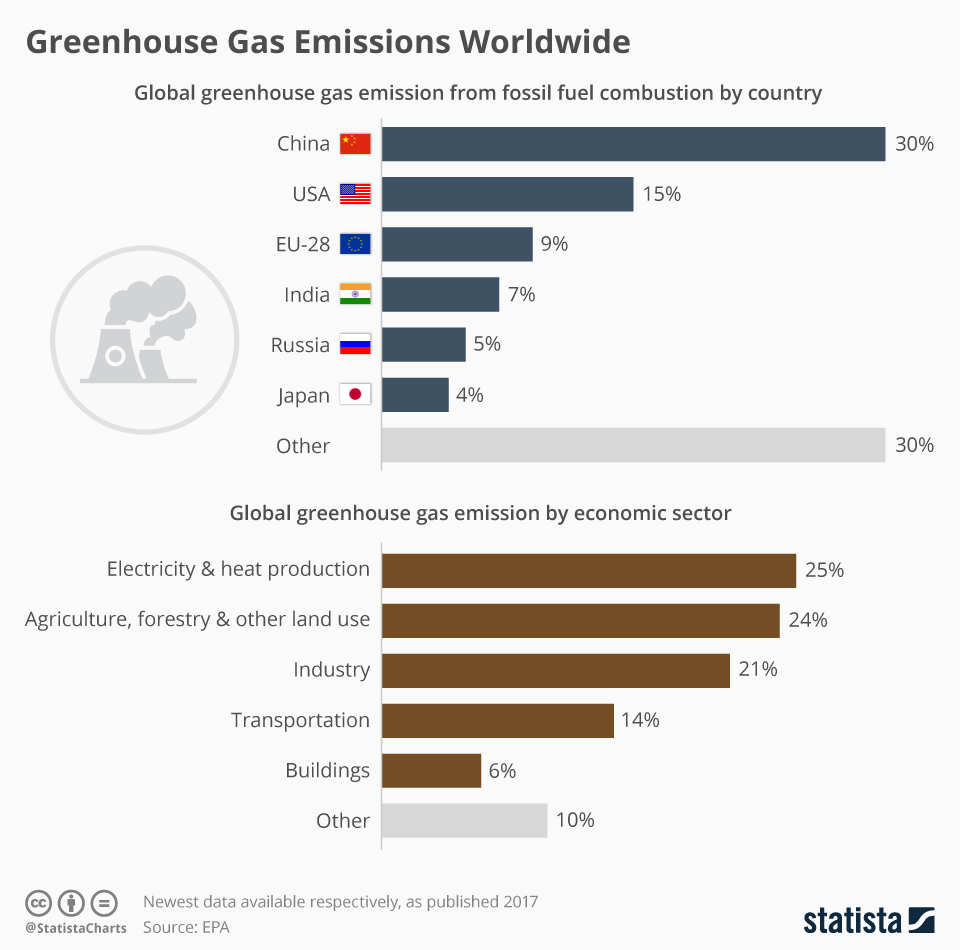
Only China tops America in greenhouse gas emission from fossil fuel combustion and industry, according the Environmental Protection Agency (EPA). Most emissions are due to electricity production closely followed by agriculture and forestry. Transportation is responsible for 14 percent of emissions.

Credit: Global GHG Emission Countries and Industries originally published in Statistica Charts 2017 (CC BY ND)

Curated by Lea Rekow for BifrostOnline
EmissionsGHGsPolluting industries

Related

Climate Change

State of the Climate

A new State of the Climate report confirmed that 2016 surpassed 2015 as the warmest year in 137 years of recordkeeping.

Global impacts for different emissions scenarios

To assist in the understanding of the IPCC’s Fifth Assessment Report, key data sets and information have been used to generate this infographic.

Carbon Emissions

U.S. per capita carbon emissions
  • Bifrost
    Themes
  • Bifrost
    Documentaries
  • Bifrost
    Insights
  • Bifrost
    Features
  • About
    Bifrost
  • Bridges
  • Papers &
    Reports
  • Interview
    Transcripts
  • Infographics
  • Maps
  • Science
  • Data
    Visualizations
  • Climate Stories
  • Podcasts
  • Presentations
  • Curated
    Perspectives
  • Sound Art
  • Image
    Galleries
  • How it
    Works
  • Exposing Denial
  • Calculators &
    Indices
  • Climate Kids
  • Open
    Learning
  • Resource
    Atlases
  • SDG
    Trackers
  • Toolkits
  • Mobilize
  • Twitter
  • Facebook
  • Instagram
  • Youtube
  • Privacy Policy