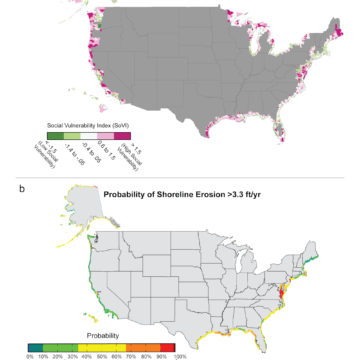
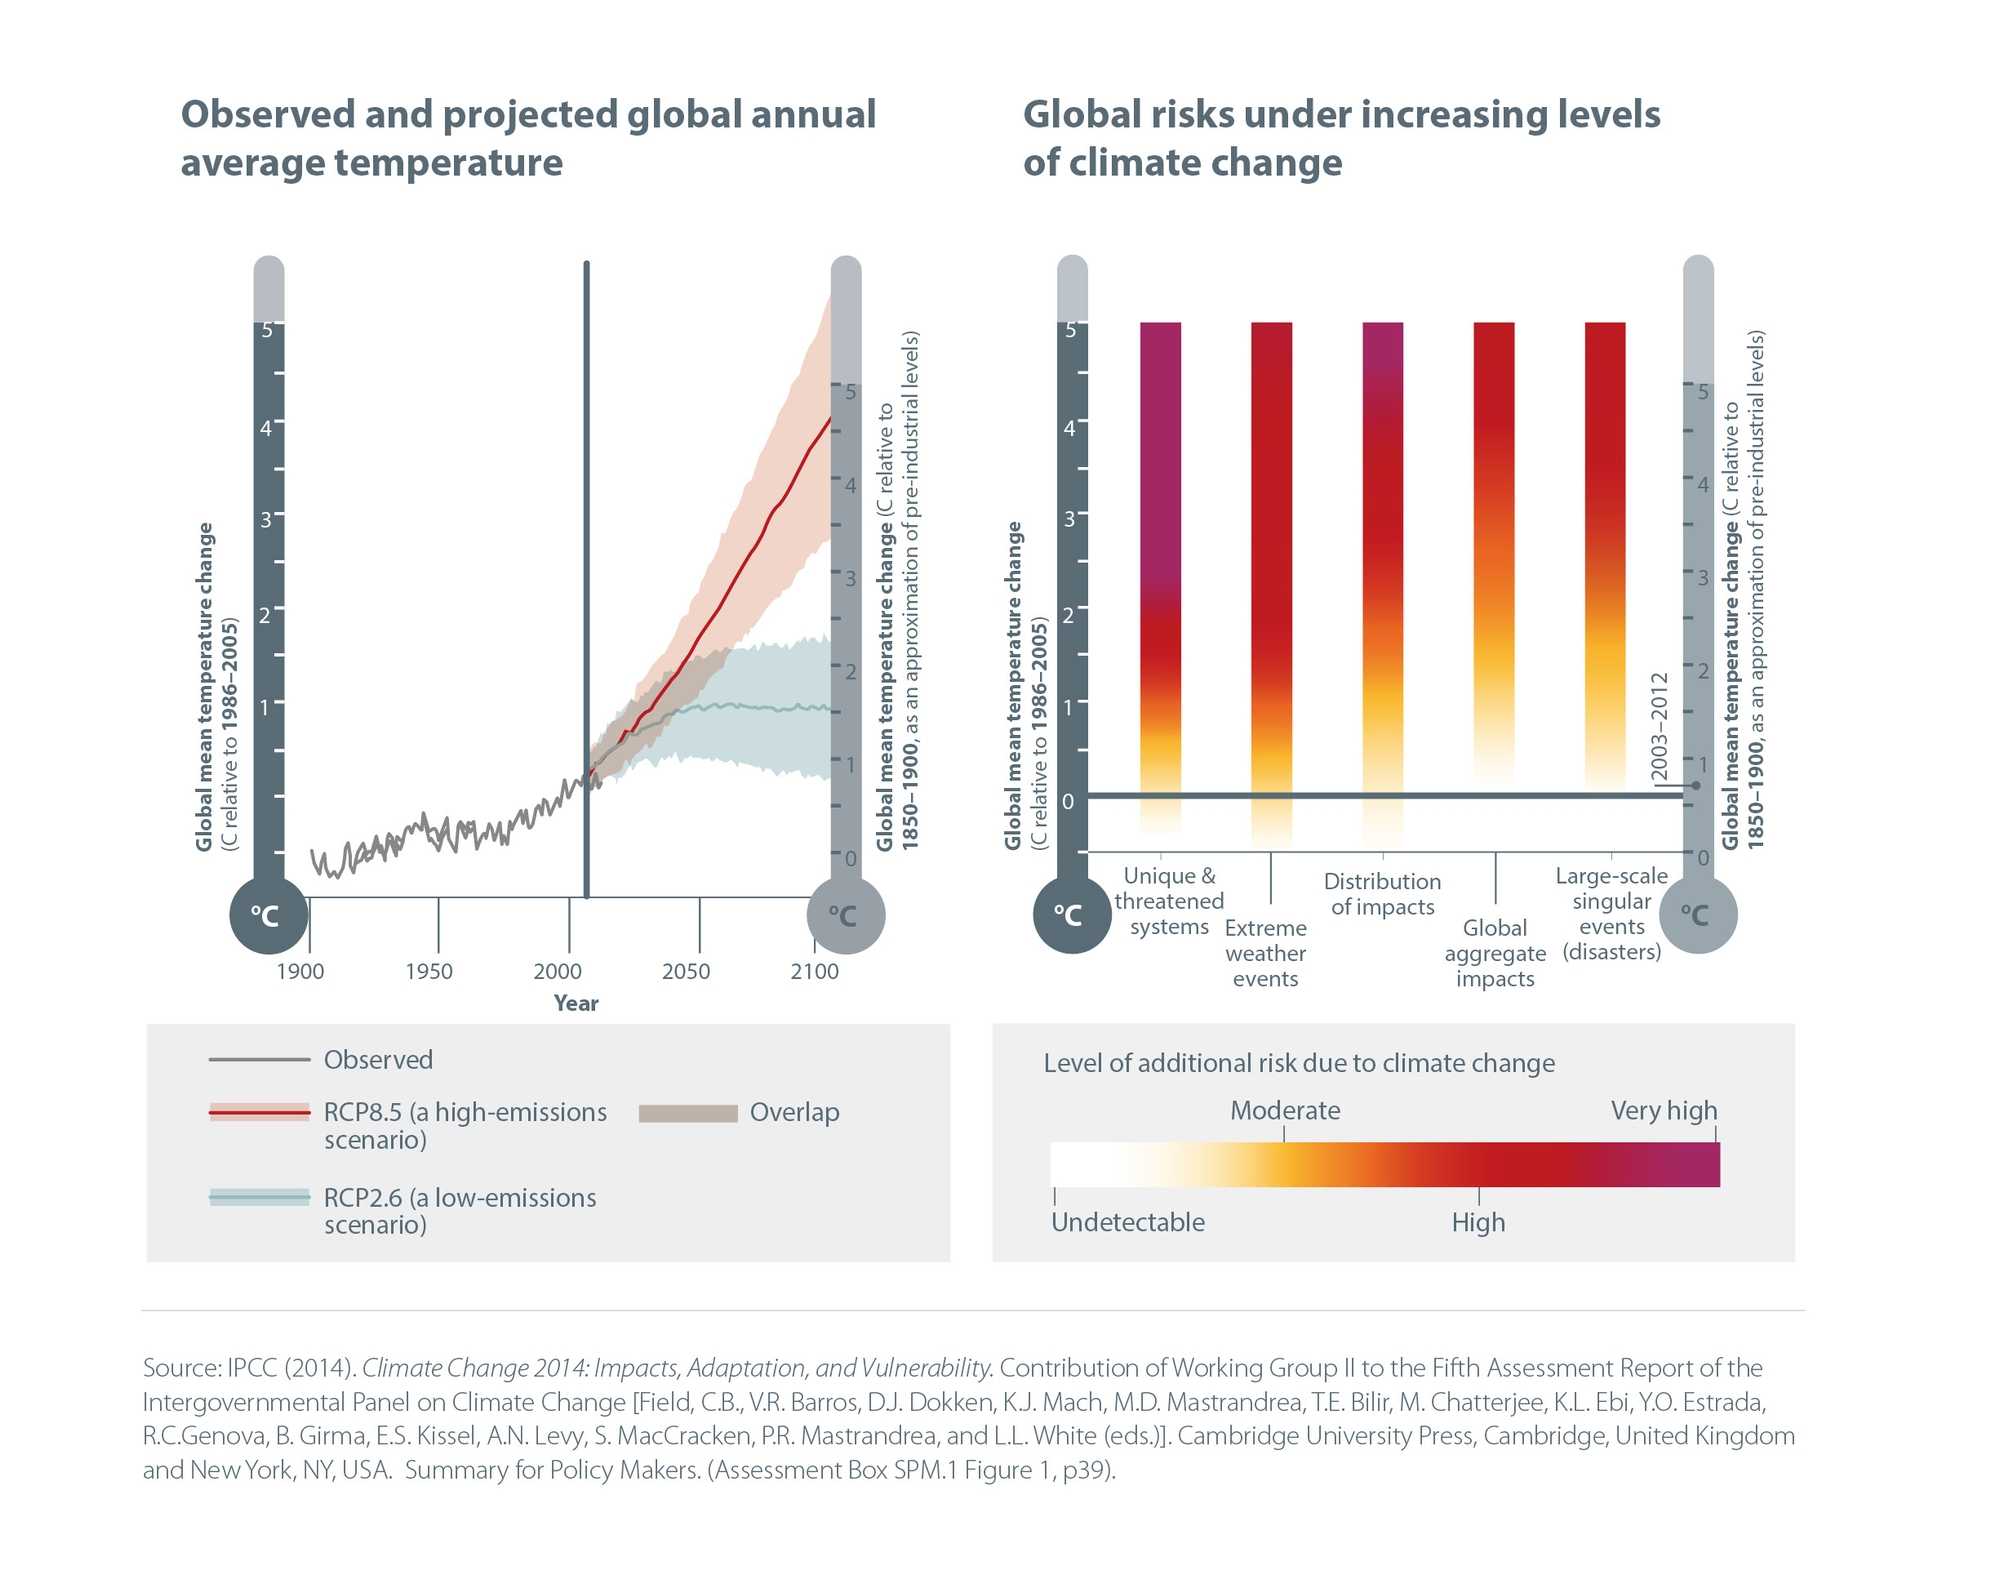
Global impacts for different emissions scenarios
To assist in the understanding of the IPCC’s Fifth Assessment Report, key data sets and information have been used to generate this infographic.
It is available for educational purposes and to encourage discussion around the report. Permission requests for republication should be sought directly from the Climate and Development Knowledge Network.