Understanding sea-level rise
Overview
The seas of the Earth are rising, a direct result of a changing climate. Ocean temperatures are increasing, leading to ocean expansion. And as ice sheets and glaciers melt, they add more water. An armada of increasingly sophisticated instruments, deployed across the oceans, on polar ice and in orbit, reveals significant changes among globally interlocking factors that are driving sea levels higher.
Yet the globally averaged trend toward rising sea levels masks deeper complexities. Regional effects cause sea levels to increase on some parts of the planet, decrease on others, and even to remain relatively flat in a few places, including, in recent decades, on the California coast. Thermal expansion of seawater can be the product of regional phenomena, such as El Niño, the periodic warming of the eastern tropical Pacific. But some of these regional cycles so far show no direct link to long-term global climate change—despite, at times, independently exerting a powerful short-term influence on global climate.
And while Greenland, Antarctica and most of the world’s glaciers are melting, a distinction must be made between glacial discharge into the oceans, a more permanent type of ice loss, and changes in the precipitation and evaporation that is feeding those glaciers and ice sheets, which fluctuate on the scale of decades.
Drivers of Change
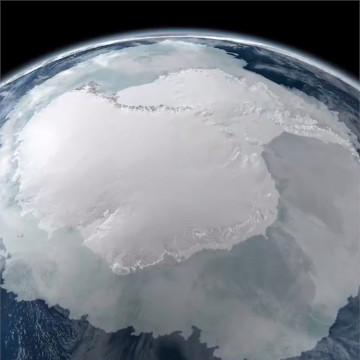
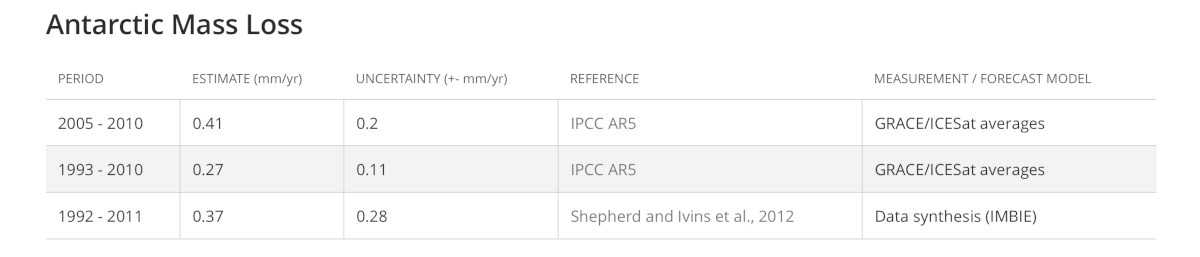
Greenland and Antarctica
Ice loss near the poles is one of the most critical changes pushing sea levels higher, a conclusion supported by data of increasing weight and accuracy. Greenland’s contribution to global sea-level rise is the largest, and increases every decade. Studies suggest that its melt grew from 0.09 millimeters per year between 1992 and 2001, expressed as the global sea-level rise equivalent, to 0.59 millimeters per year between 2002 and 2011 [Velicogna et al, 2014].
Glaciers and ice caps
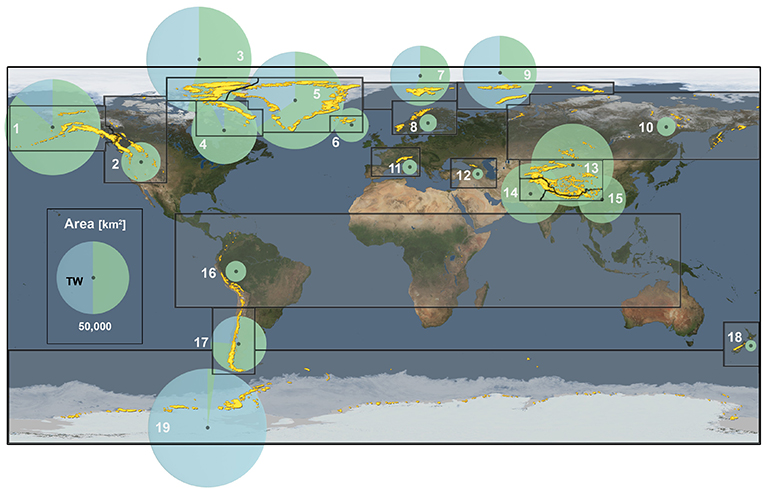
Measurement of the Earth’s many glaciers and ice caps—smaller ice masses that are not a part of the Greenland or Antarctic ice sheets— show accelerated retreat. Together, they also account for about a third of the present sea level rise planet-wide (between 2.6 and 2.9 millimeters per year over at least the past 20 years). That places these smaller ice masses in the top three contributors to sea level rise, along with the warming of ocean water, which causes it to increase in volume, and the melting of the great ice sheets of Greenland and Antarctica. The largest losses are from Arctic Canada, Alaska and coastal Greenland, but with significant contributions from other regions, such as the Andes in southern Chile, Argentina or the Himalayas [Gardner et al., 2013].
Thermal expansion
The warming of Earth is primarily due to accumulation of heat-trapping greenhouse gases, and more than 90 percent of this trapped heat is being absorbed by the oceans. Water volume rises with temperature because of thermal expansion — another major driver of sea level rise.
Postglacial rebound, self-attraction and loading
The basins that hold Earth’s oceans do not remain static. Over long time scales they shift and deform in response to powerful forces. Because these, too, can alter sea levels, scientists must tease apart their effects from those of melting ice and thermal expansion.
One of the most important of these is post-glacial rebound, also known as glacial isostatic adjustment (GIA). At the close of the last ice age, some 10,000 years ago, the retreat of massive ice sheets from North America and the Eurasian continent lightened the load on the underlying mantle, deep below the Earth’s surface. The mantle is viscous, not solid, so it rebounds slowly, raising the rock layer above—the lithosphere—over thousands of years. This gradual lift, the recovery from the last ice age, continues today, altering the shape of ocean basins. And these alterations widen the basins, lowering apparent sea level by about 0.3 millimeters per year [Douglas and Peltier, 2002]. Researchers must factor this effect into their calculations when estimating the rate of sea level rise due to climate change.
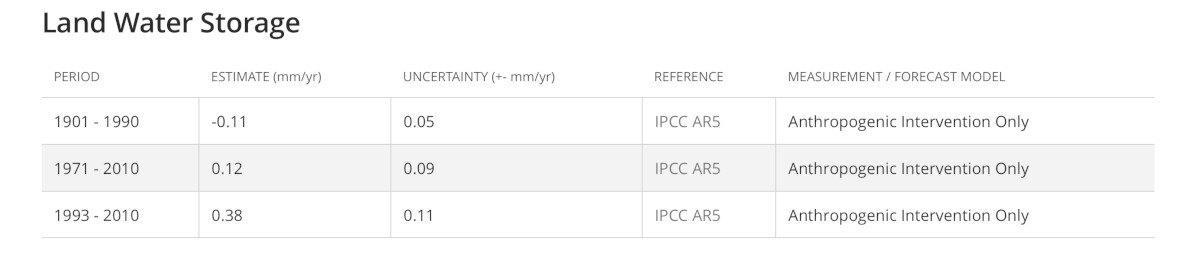
Land Hydrology
The Earth cycles water annually between land and ocean, in regional patterns of precipitation and evaporation, and this cycle also may be accelerating in response to climate change—with more variability, more flooding and more frequent drought. Human manipulation of this water cycle, including increasingly high levels of groundwater withdrawal, contributes to sea level rise; the water withdrawn is ultimately reclaimed by the sea. And while the contribution is smaller than that of thermal expansion and melting ice, it is not insignificant.
Local Effects
Tides
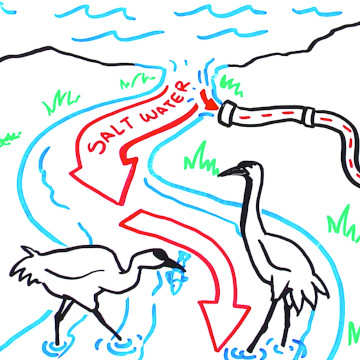
Sea level changes near coastlines include tides, a kind of wave caused by the gravitational effects of the sun and moon, along with the Earth’s rotation.
Tidal changes across various time scales, though cyclic, can be superimposed upon the background rise in global sea level; add regional rise driven by ocean circulation, and the highest tides can begin to cause flooding in coastal zones that were previously unaffected, or that experienced such flooding at lower frequencies.
Storm surge
Storm surge is a higher-than-normal rise of coastal waters, above the astronomical high tide. Its main causes are strong winds within a tropical storm or hurricane, both literally pushing seawater and creating huge waves that travel to the coast and break there. Low atmospheric pressure also induces a dome of water near the storm center. Precipitation and the Coriolis effect may also play a role.
While making direct causal connections between globally averaged climate change and individual storms remains very difficult, improved modeling techniques offer a rare chance to forecast the potential imprint of the global climate signal on short-term, localized meteorological events as the next few decades unfold.
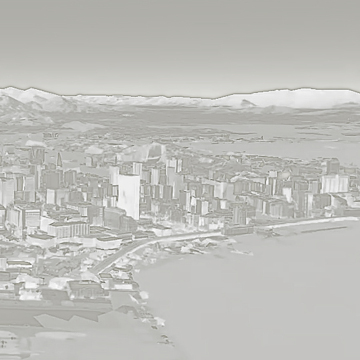
Subsidence
Relative sea level also can rise because the land itself is sinking—visible in extreme form in the California Bay Delta. Some of the islands amid this 2,900-square-kilometer network of water channels and farmland have dropped to eight meters or more below sea level [Mount et al., 2005], due mainly to microbial oxidation and soil compaction—the legacy of more than a century of farming. One low-resolution modeling study suggested the additional strain placed on levees as the land surface subsides, coupled with rising sea levels, are sharply increasing the risk of floods resulting from levee failure [Mount et al., 2005]. These factors contributed to the study’s estimate of a two in three chance of catastrophic flooding in the Delta by 2050, triggered by a 100-year flood or earthquake event.
While subsidence occurs naturally, it can be greatly accelerated by human activity. Groundwater and hydrocarbon extraction, for example, can cause compaction of sediments [Waltham, 2002]. Subsidence related to groundwater withdrawal can be especially pronounced in river deltas with large populations and extensive agriculture, among them Thailand’s Chao Phraya, the Bengal Delta of India and Bangladesh, China’s Yangtze and the Egyptian Nile [Ericson et al., 2006].
Sharpening the accuracy of global sea-level rise estimates will require a clearer picture of other land-based influences on water storage and transfer. These include human engineering, such as the construction of reservoirs for water storage or dams to hold water back, which can tip the balance toward water storage on land (though the effects of groundwater depletion now surpass those of reservoir storage, keeping that balance tipped toward the ocean). The potential consequences of groundwater pumping that can raise sea levels by bringing land elevation down, the draining of wetlands and the conversion of habitat types also remain difficult to assess, but hold some of the keys to a more precise characterization of land-based contributions to sea level rise.
Overview
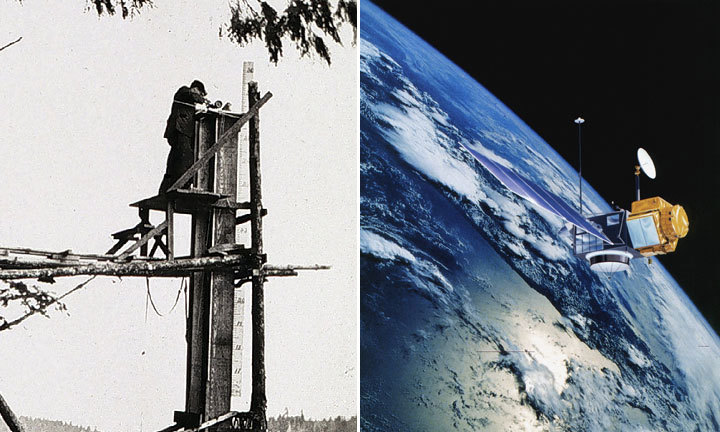
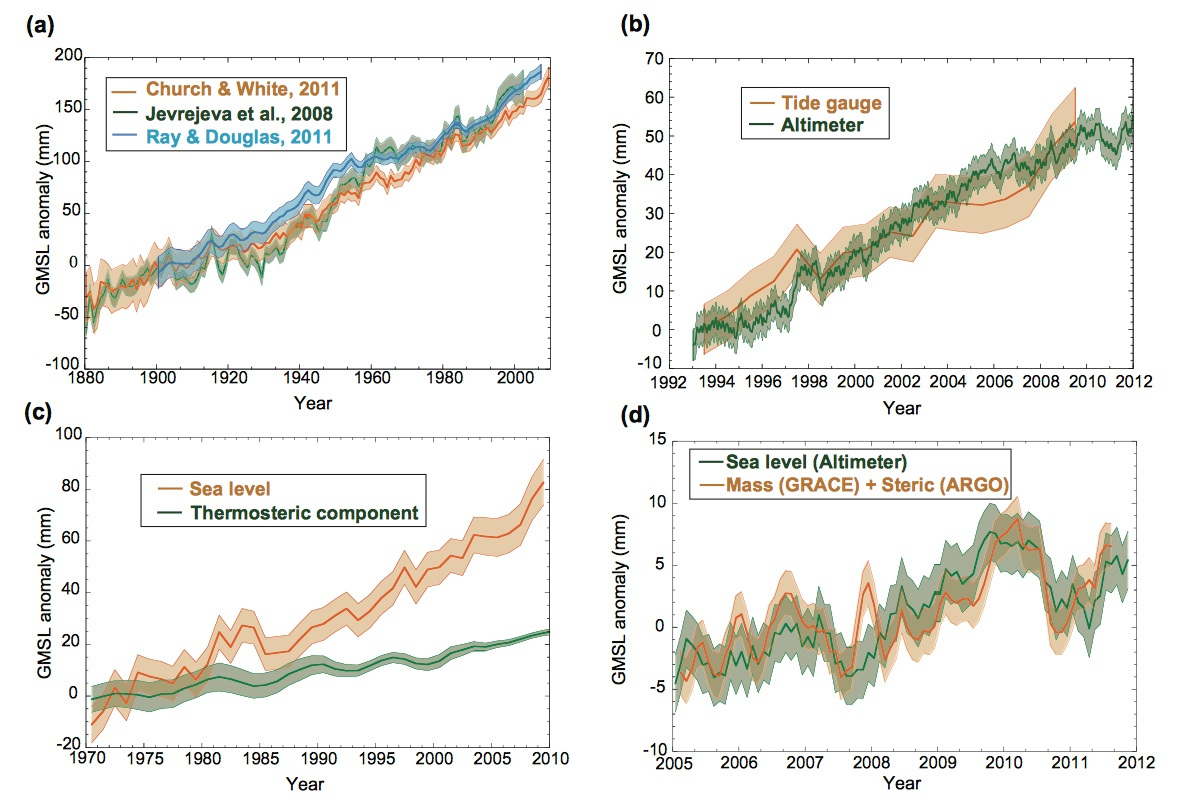
One of humankind’s earliest attempts to keep long-term records of rising seas began in ancient Venice — appropriately enough, given its forced adaptation to slow inundation over many centuries [Carbognin et al. 2009]. The evolution of measurement technology soon accelerated. Marks cut into building walls gave way to tide gauges in the 19th and 20th centuries and, by the dawn of the 21st, satellite altimetry, with gravimetry soon to follow. Proxy records, meanwhile, had been kept over thousands of years by ocean organisms, sedimentary deposits and the action of waves against rocks and salt marshes, awaiting scientists who could learn to read them. Archaeological sites were interrogated for data on sea-level shifts, among them the Roman columns of the Phlagrean Fields. They revealed, via the borings of marine organisms, that this ancient marketplace had been submerged and uplifted over millennia [Morhange et al., 2006].
Critical realizations included the importance of vertical land motion in assessing changing sea levels, as well as the seasonal, year-to-year and decadal variations in regional climate, interwoven with the longer-term signal of global sea-level rise. Sea level observations today yield a rich tapestry of overlapping effects, though its threads must be unraveled to trace individual contributions to the larger mosaic.
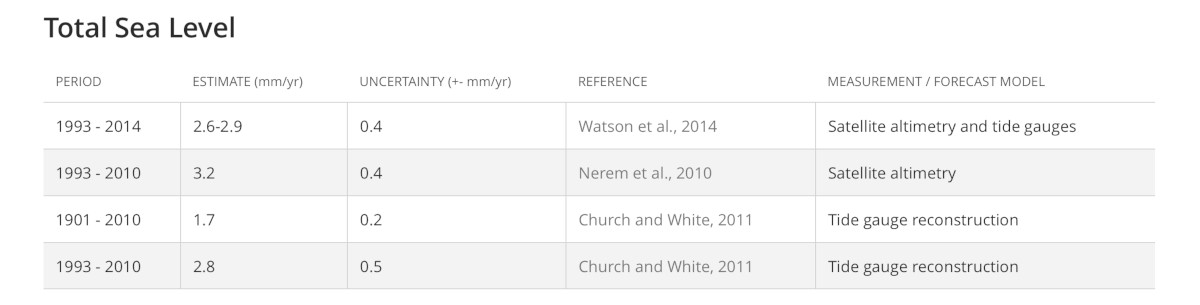
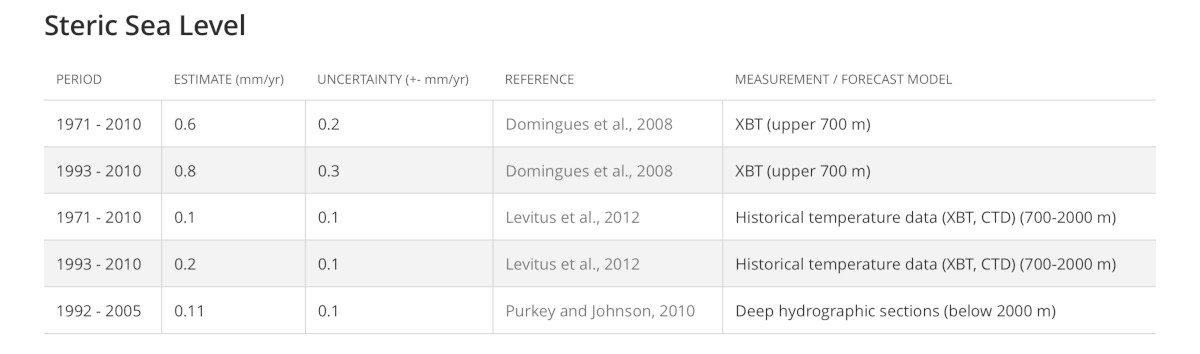
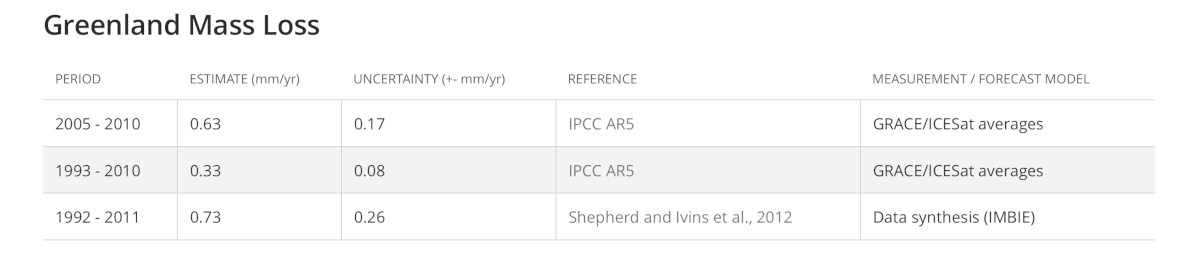
By the numbers: Estimates for sea level rates for different time periods

Adaptation
As humanity experiences the early effects of a rapidly changing climate, policymakers focus on two primary responses: mitigation, or direct intervention such as reducing emissions, and adaptation, or modifying infrastructure or behavior to adjust to climatic change. Rising temperatures and sea level, increased coastal flooding and perturbation of weather patterns are among the changes likely to require an adaptive response. Projections, including those mentioned above, have become essential tools for planners seeking to anticipate the profound changes ahead.
A recent projection [Hinkel et al., 2014] found that, absent adaptation, 0.2 to 4.6 of Earth’s population–tens of millions or more–could see yearly flooding by 2100, assuming a 25 to 123 centimeter (0.8 to 4 foot) rise in global mean sea level. That translates to yearly losses in gross domestic product of 0.3 to 9.3 percent. Adaptive measures, such as construction of dikes for coastal protection, would bring yearly investment and maintenance costs to $12 to $71 billion by 2100–likely a far smaller figure than the cost of the damages that would otherwise be unavoidable.