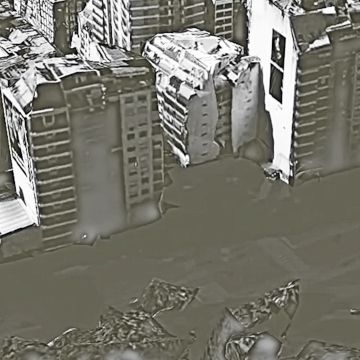
Mapping Choices: Rio de Janeiro, Brazil
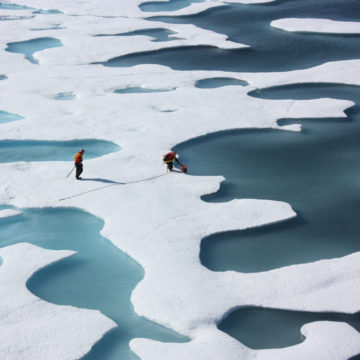
Global warming has raised global sea level about 8 inches since 1880, and the rate of rise is accelerating. Rising seas dramatically increase the odds of damaging floods from storm surges. A Climate Central analysis finds the odds of “century” or worse floods occurring by 2030 are on track to double or more, over widespread areas of the U.S. These increases threaten an enormous amount of damage. Across the country, nearly 5 million people live in 2.6 million homes at less than 4 feet above high tide — a level lower than the century flood line for most locations analyzed. And compounding this risk, scientists expect roughly 2 to 7 more feet of sea level rise this century — a lot depending upon how much more heat-trapping pollution humanity puts into the sky.
Climate Central’s 2015 Mapping Choices report—and its associated images and videos—have to do with long-term sea level rise that near-term emissions can lock in by 2100 or 2050 based on different emission scenarios, but does not put a firm date on when the long-term sea level rise projections are fulfilled. Different eventualities could be locked in by carbon emissions in the coming decades and century. Carbon emissions this century can lock in these projected threats, but the associated sea level rise is expected to play out over a longer period, likely centuries. Access Climate Central’s interactive map and click on the “When will this happen?” pop-up to learn more.
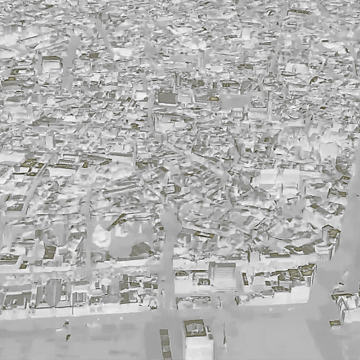
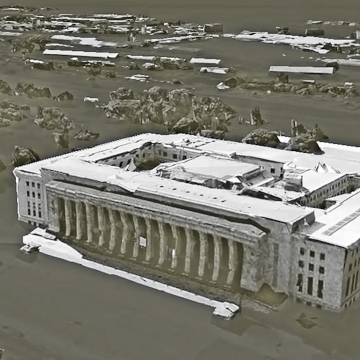
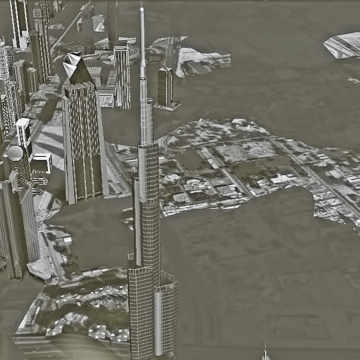
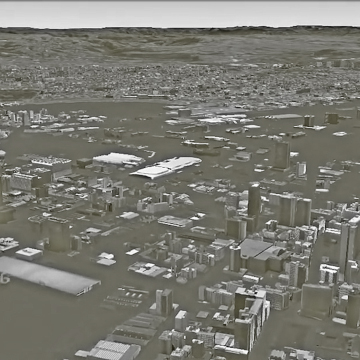
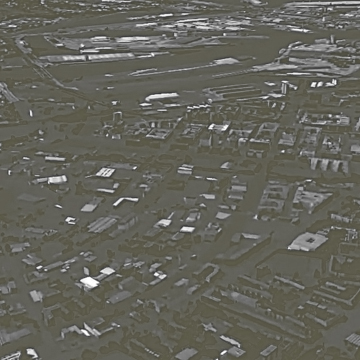
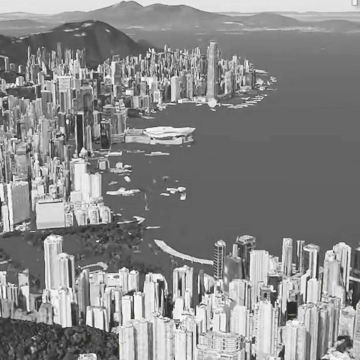
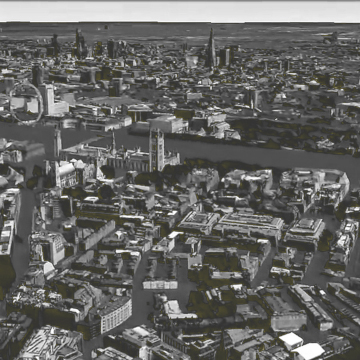
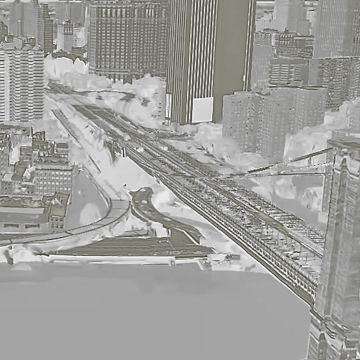
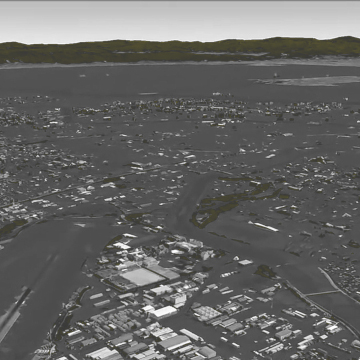
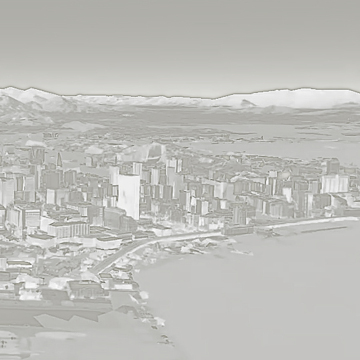
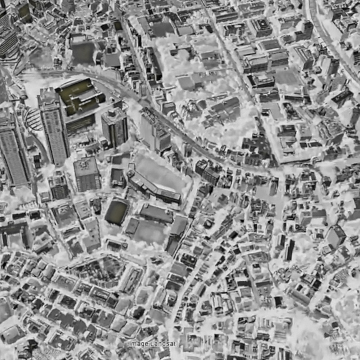
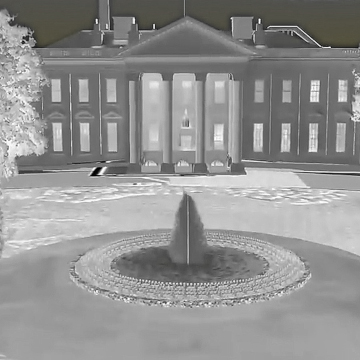
The sea level imagery in Google Earth shown above is based on overlays of peer-reviewed sea level projections against Google elevation data. Areas shown as affected may vary slightly from areas shown for the same layers at choices.climatecentral.org, which uses the same sea level projections overlaid against lidar-based elevation data within the U.S. and NASA satellite-based elevation data outside the U.S. Google also uses these sources, but substitutes other sources in many areas, plus processes elevation data in ways that smooth local elevation profiles. In areas where Google has acquired more accurate data, elevations will on average be lower, and thus more features will generally be shown as below projected sea level. NASA’s satellite-based data does not differentiate bare earth from buildings or vegetation, commonly leading to overestimates of ground elevation, and underestimates of exposure to sea level rise.
Using science-based KML layers, Climate Central has created fly-over videos for many coastal cities around the world where 3-D building data is currently available in Google Earth. Download the KML file and make your own, to better understand and contrast what it means to continue carbon emissions on our current trend — the 4°C layer (7.2°F) — or limit warming to the current international goal — the 2°C layer (3.6°F). The KML file also provides 1.5°C (2.7°F) and 3°C (5.4°F) layers.
Source: Climate Central